
In 2009, the US and Australian stock markets slid 55.65% and 53.95% respectively, all within a 15 month period. Your $1,000,000 share portfolio would have been worth around $450,000. Here’s what it looked like:
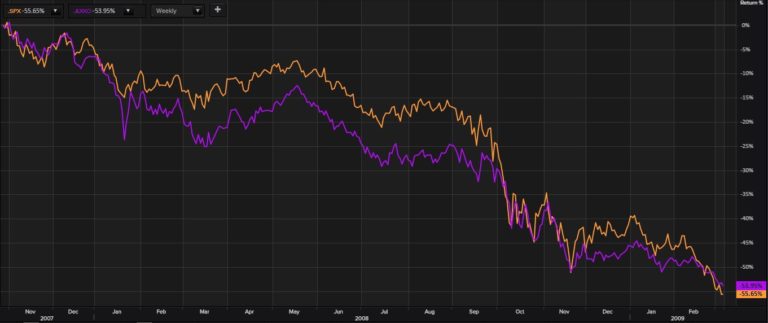
Source: Thomson Reuters
Investors were liquidating their portfolios and piling into cash as there was no end in sight. Fear and uncertainty were at an all time high, even though the duration of this bear market was shorter than the average.
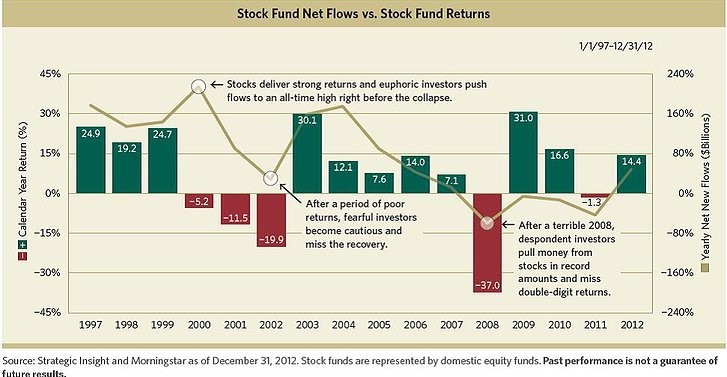
In fact, by the time the market bottomed out in 2009, investors were selling down their share portfolio at the fastest pace in over a decade. Precisely at the worst time:
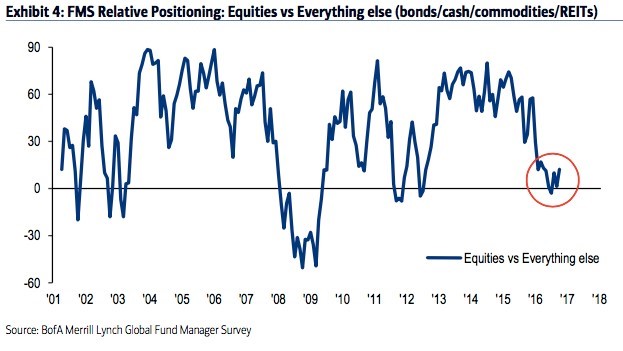
The ‘pros’ were giving in too. In 2009, global fund managers’ allocations to the share market relative to other asset classes were at an all time low.
Humans are an irrational bunch. We tend to think in certain ways that lead to systematic deviations from good judgement. Here’s what happened next. US stocks climbed a whopping 255.44%, and Aussie stocks up (a mere, relative to the US) 82.79%:
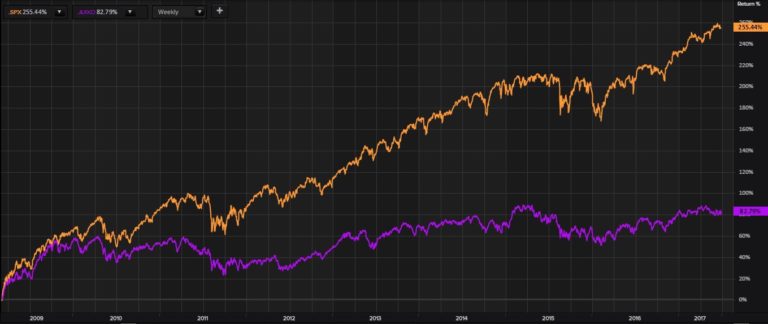
Source: Thomson Reuters
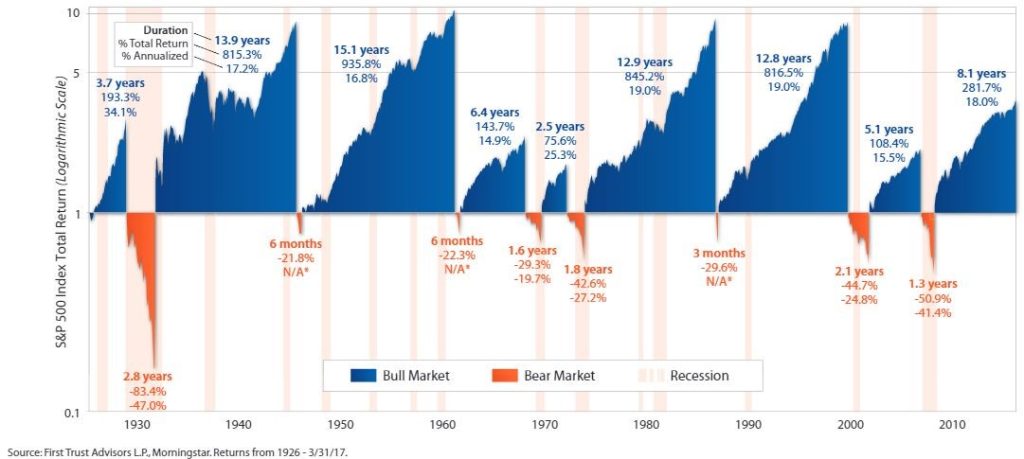
With the stock market at all time highs, and having lasted for so long, we’re hearing commentators and investors question the market’s ability to push any higher. The current bull market has lasted around 8.1 years, making it the 5th longest bull market since 1926. Although it feels like it’s the longest, right? In fact, it’s also 5th not only in it’s duration, but also in magnitude.
Since 1926, the average bull market has lasted around 8.9 years, with an average cumulative gain of 468%. The current bull market has gained around 255%. What’s interesting from the chart below, is how dominating the blue shaded areas are relative to the orange (bear markets). The average bear market has lasted 1.4 years with an average cumulative loss of 41%:
I thought it would be interesting to see the stats for the Australian share market, so I ran the numbers and have summarised in the table below. Of the 351 months since 1980, the Australian stock market has been up 220 periods (63% of the time), and down 131 periods (37% of the time).
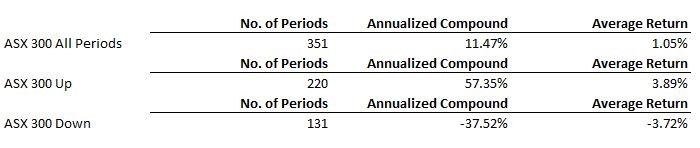
Source: Returns 2.0
If you then extend your time horizon to a rolling 5 years, since 1980, the Australian stock market has only ever seen 1, 5 year period of negative returns. It began in 2007 and fell on average -4.27% pa for 5 years. Every other 5 year rolling period has seen the Australian share market return a positive number with an average return of 11.52% pa:
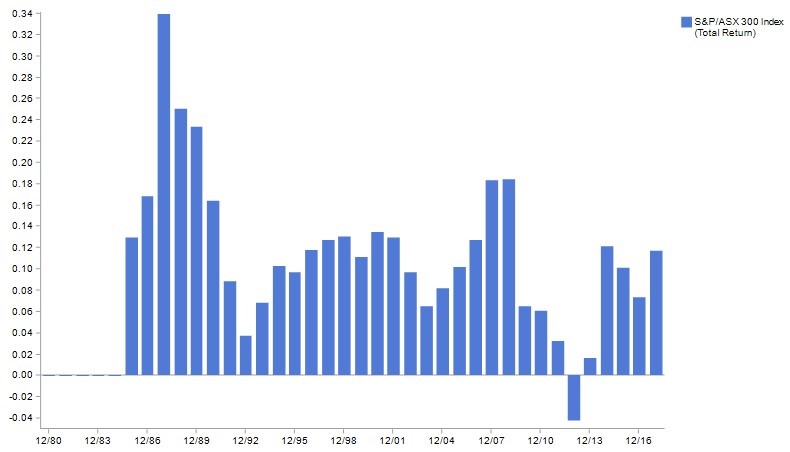
Source: Returns 2.0
Even after one of the greatest crisis in history, if you had simply held course, here’s what your portfolio would have looked like. A $1,000,000 investment at the peak of the stock market would be worth $1,325,000 today:
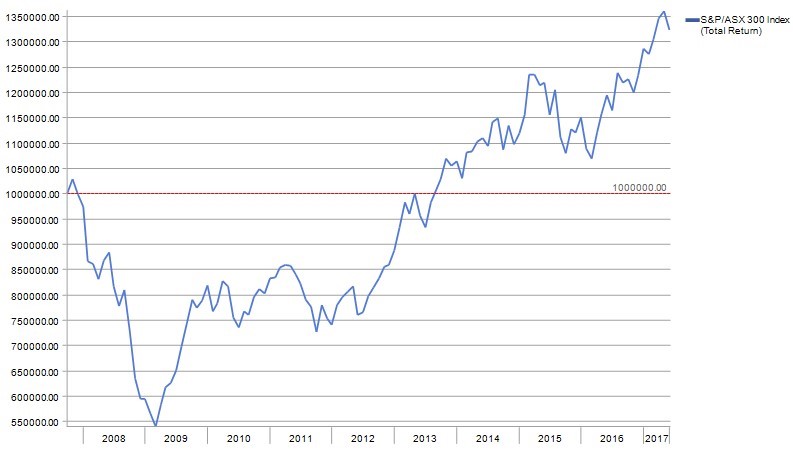
Source: Returns 2.0
Whether this market will collapse tomorrow, or in 12 months from today, nobody really knows. What is certain however, is that there will be another collapse, and that you’ll be told that it’s different this time (it’s unlikely to be). In the end, it’s completely out of our control.
Design and construct your portfolio today as if the market will crash tomorrow. Because that is when your true emotions will flourish. How tolerant are you to volatility and risk? What is your investment horizon? How patient and disciplined are you? These will all be challenged. Your actions from these emotions are all in your control. What the market does is not.
*Blog originally published by Robert Baharian, Founder @ Baharian Wealth Management.